About This Survey
This report is based on responses from 134 startups. The respondent pool is not a random sample of all startups. It skews toward early-stage, founder-led, companies actively thinking about legal as a business function.
With 134 responses, sample sizes for some cross-tabulations are small (particularly at Series C and above). We note sample sizes throughout and flag where the data is suggestive rather than conclusive.
But here is the reality: there is virtually no publicly available data on how startups spend on legal, how they structure their legal functions, or how satisfied they are with the results. Founders making six-figure legal decisions are doing so in an information vacuum. The goal of this report is to change that. Even where the data is directional rather than definitive, it gives founders something they have never had before: a relevant peer set to benchmark against.
Section 1: Who Responded
Company Stage & Size
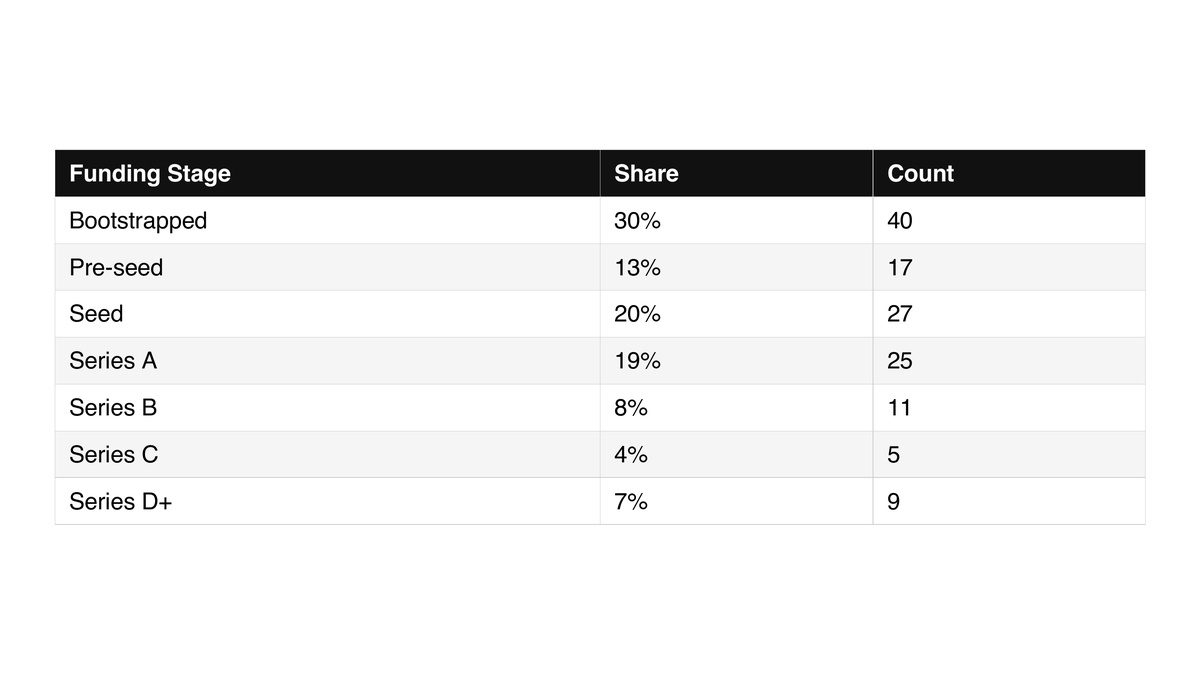
The respondent pool skews early-stage and lean. Nearly half (44%) of companies are bootstrapped or pre-seed, and 35% have five or fewer employees. The 3–10 year age band makes up 58% of respondents, suggesting a cohort that has been around long enough to accumulate meaningful legal needs but is still resource-constrained.
Industry Mix
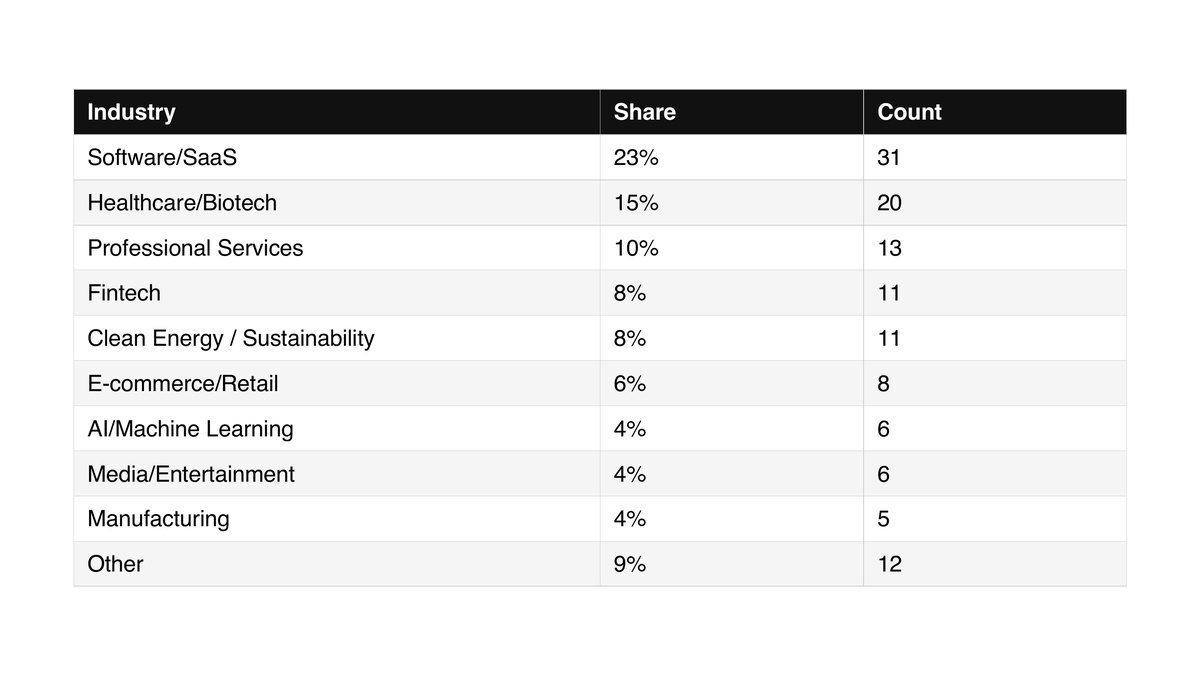
Software/SaaS leads at 23%, followed by Healthcare/Biotech (15%), Professional Services (10%), Fintech (8%), and Clean Energy (8%). Only 4% of respondents selected AI/Machine Learning as their primary industry, though that number likely understates AI’s presence in the data. In 2025, the line between an “AI company” and a SaaS, healthcare, or fintech company that uses AI heavily is increasingly blurry.
Geography
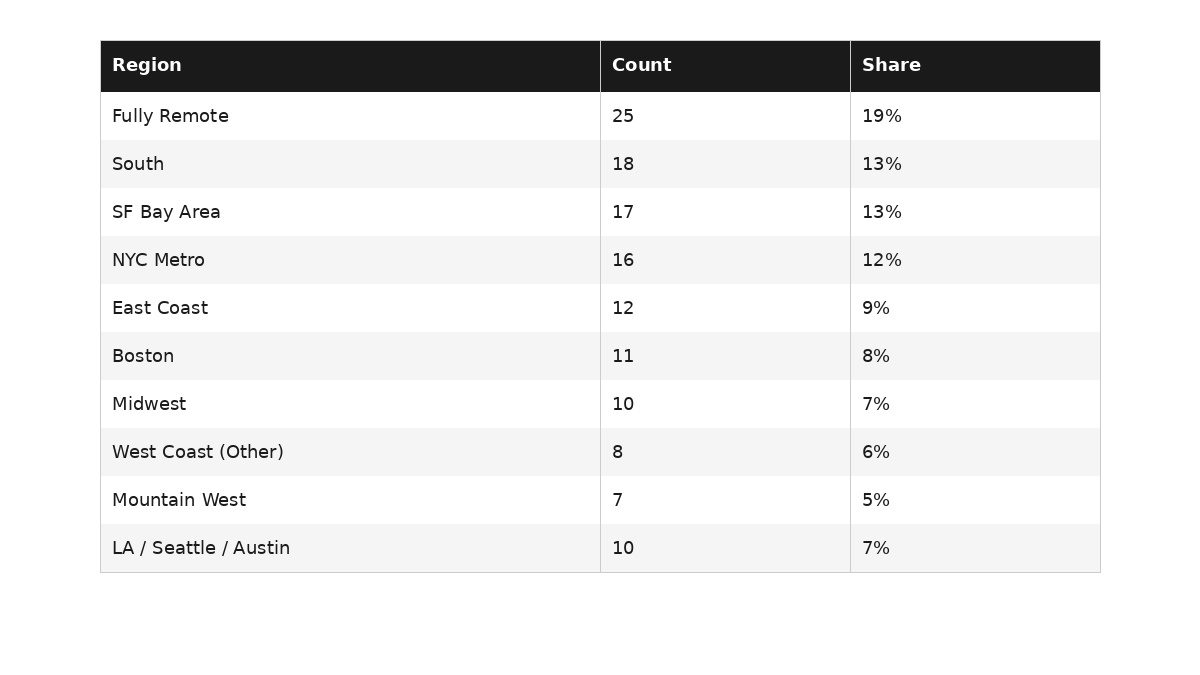
Fully Remote is the single largest “region” at 19%, followed by the South (13%), SF Bay Area (13%), and NYC Metro (12%). Traditional tech hubs (SF + NYC + Boston + Seattle + LA) account for 39% of respondents, but the majority of startups are now outside those corridors. This geographic dispersion has implications for how legal services are delivered, as founders outside major hubs have fewer local options and may rely more heavily on remote counsel and AI tools.
Section 2: Legal Spend
Overall Spend Distribution
The typical startup in this survey spent under $20,000 on legal in the past year. 37% of all respondents fall into that lowest bucket. But this headline number masks enormous variation by stage, headcount, revenue, and industry. The sections below unpack each dimension.
Legal Spend by Funding Stage
Spend scales predictably with funding stage. Bootstrapped companies average $17K, Seed jumps to $101K, and Series A reaches $167K. By Series C, average legal spend crosses $329K.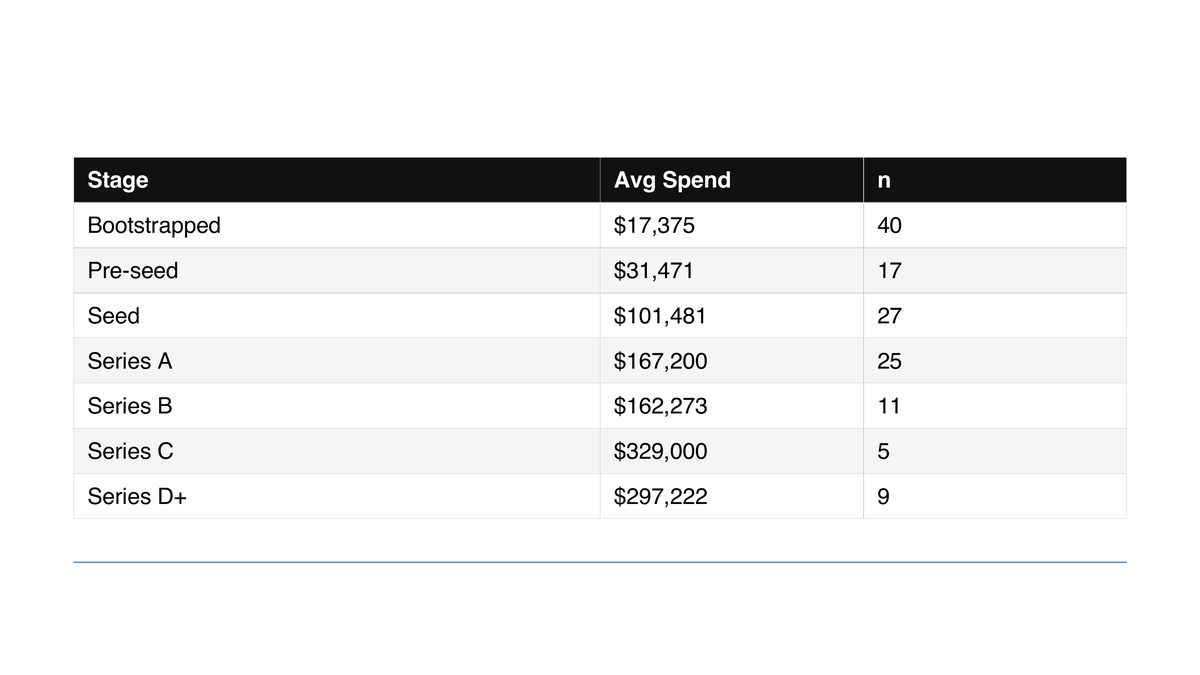
KEY FINDING
The jump from Bootstrapped ($17K) to Seed ($101K) is roughly 6x. From Seed to Series A is another 65%. Founders who plan for this curve will be better positioned at their next fundraise.
Legal Spend by Revenue
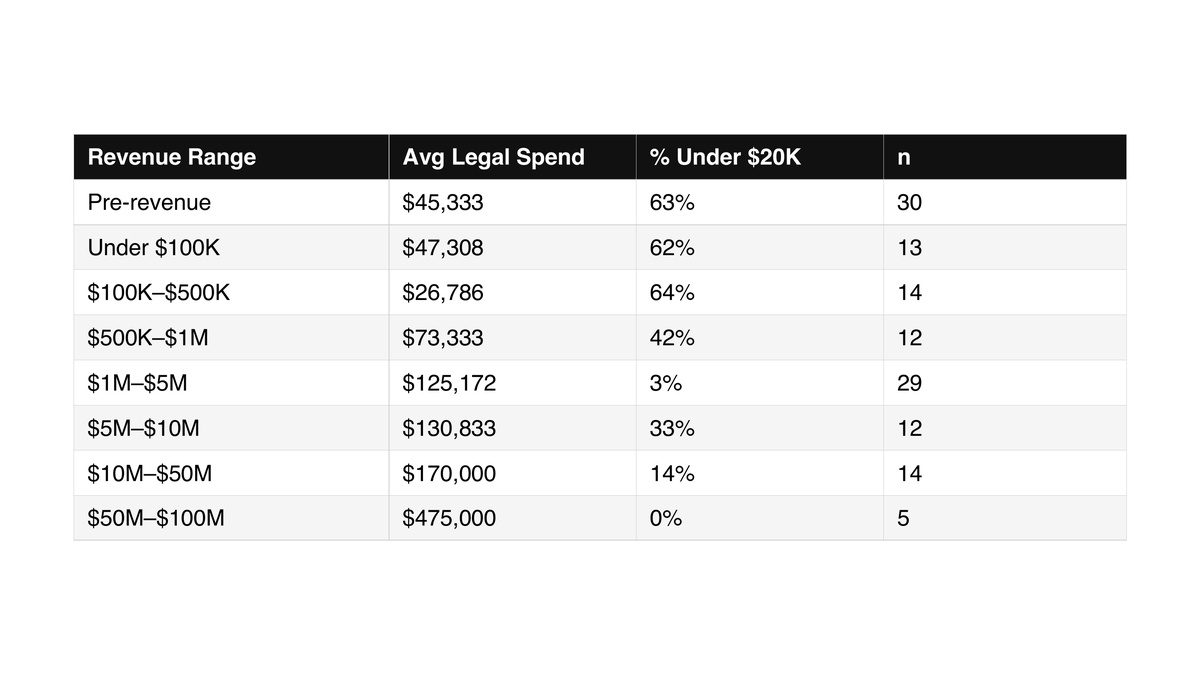
Revenue tells a cleaner story than funding stage in some respects. Companies under $500K in revenue cluster heavily in the “under $20K legal spend” bucket, with 62–64% spending less than $20K. The inflection point is crossing $1M in revenue, where average legal spend jumps to $125K and only 3% spend under $20K. By $50M–$100M in revenue, average legal spend reaches $475K.
Legal Spend as a Percentage of Revenue
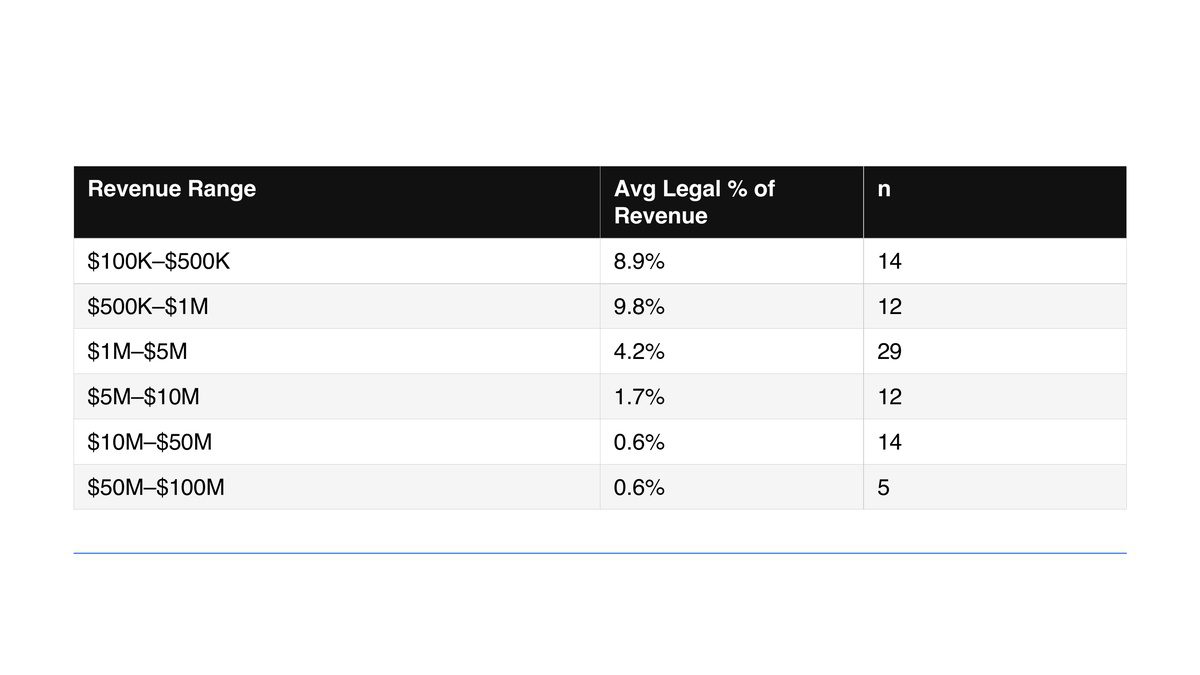
This is one of the most useful benchmarks in the dataset. Legal spend declines sharply as a share of revenue as companies scale. Companies in the $100K–$500K revenue range spend roughly 9% of revenue on legal. At $1M–$5M, that drops to about 4%. By $10M+ in revenue, legal spend falls below 1%. The absolute dollars go up, but the relative burden goes down.
KEY FINDING
If you are a $1M–$5M revenue company, the benchmark is roughly 2–4% of revenue on legal. If you are spending significantly more, it is worth auditing where the dollars are going.
Legal Spend by Industry
Industry is a strong predictor of legal spend, largely driven by regulatory complexity. Blockchain/Crypto ($275K avg) and Fintech ($180K avg) are the highest spenders, reflecting the burden of securities regulation and compliance frameworks. Healthcare/Biotech ($127K) and Clean Energy ($124K) cluster together as the next tier, both heavily regulated sectors.
Software/SaaS ($114K) lands in the middle of the pack. At the lower end, AI/ML companies average just $46K, likely reflecting how early-stage that cohort is rather than lower intrinsic legal needs. Professional Services ($15K avg) is the lowest-spending industry, with most respondents in that category being very small, bootstrapped firms.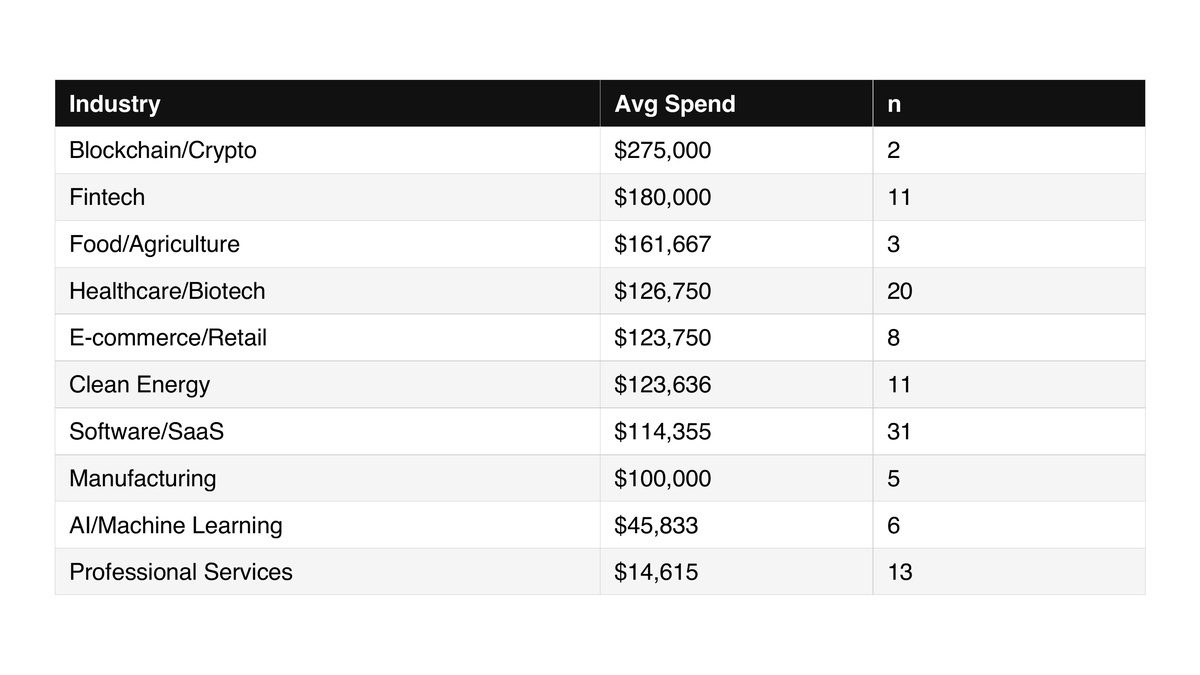
Legal Spend by Headcount
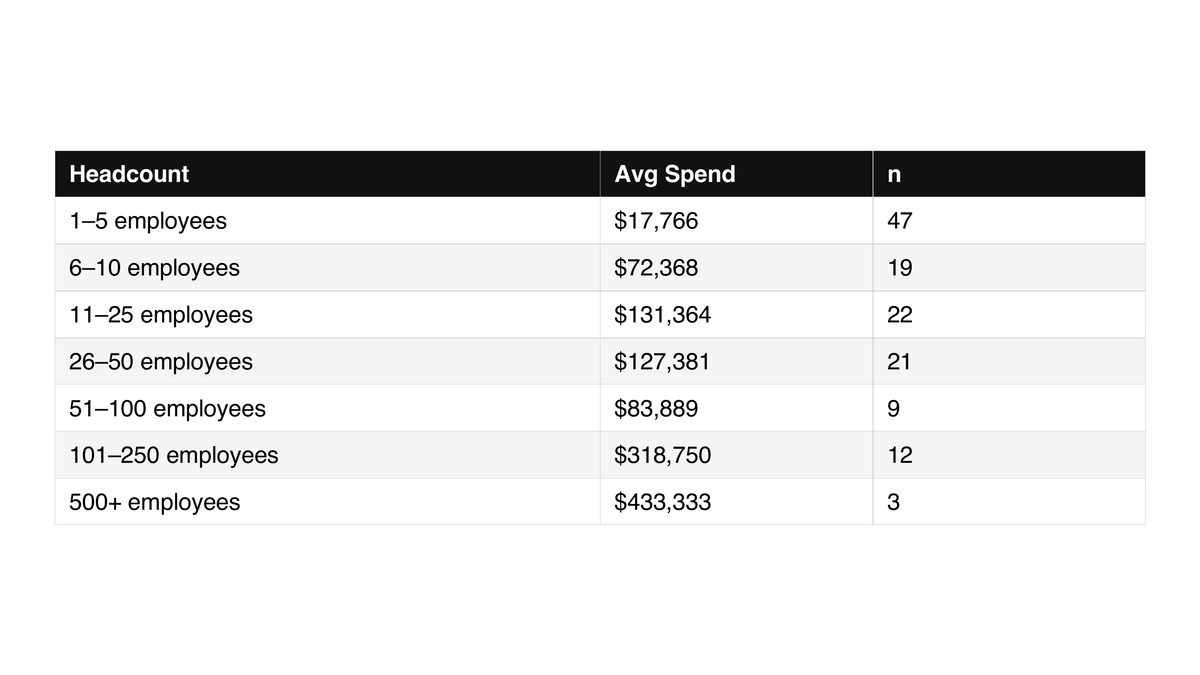
Headcount is arguably the most intuitive driver of legal spend because headcount triggers concrete legal events: first hires require employment agreements, equity plans, and benefits compliance. The first major inflection is crossing 6 employees, where average spend jumps from $18K to $72K, a 4x increase. This likely coincides with the first serious hires, first real contracts, and often the first fundraise.
The 26–50 and 51–100 employee bands show an interesting plateau (and even a slight dip). One possible explanation: companies at this size are large enough to have some internal legal sophistication but have not yet hit the complexity that comes with 100+ employees, where legal spend ramps again to $319K.
Legal Spend by Company Age
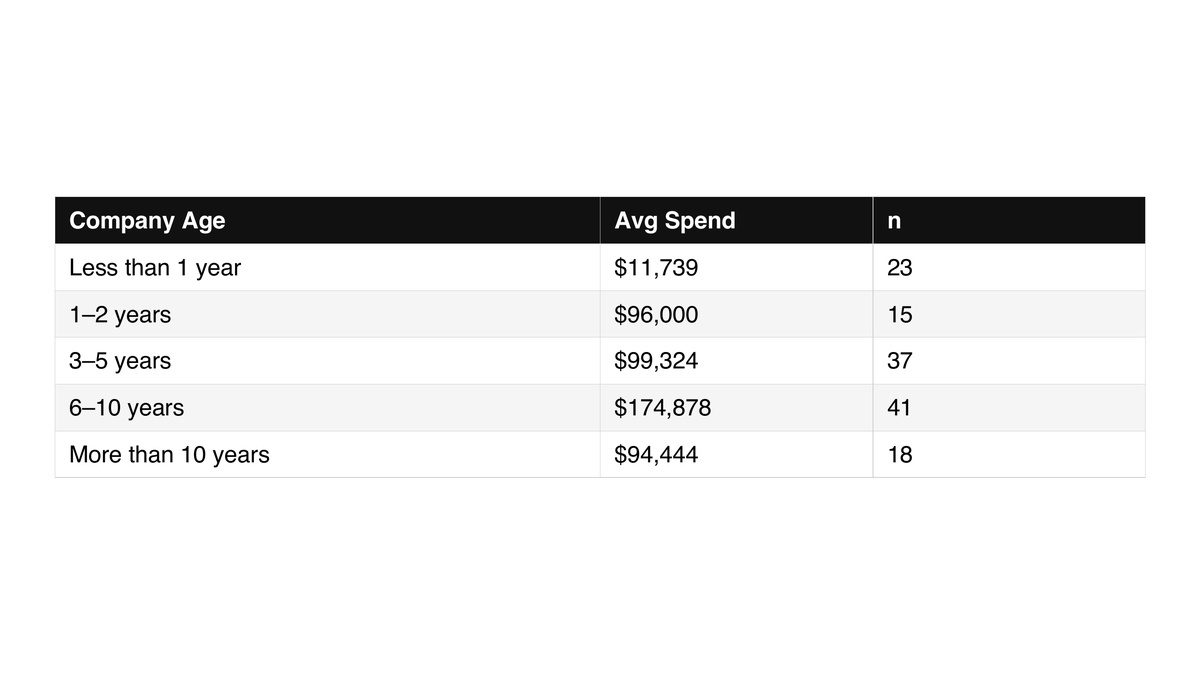
Companies less than a year old average just $12K in legal spend, with nearly all at the under-$20K level. By years 1–2, the average jumps to $96K, which is the steepest single jump in the dataset. This aligns with the period when most companies are incorporating, raising initial capital, hiring early employees, and signing their first commercial contracts. The 6–10 year cohort spends the most at $175K, reflecting accumulated complexity.
Where the Money Goes: Top Legal Needs
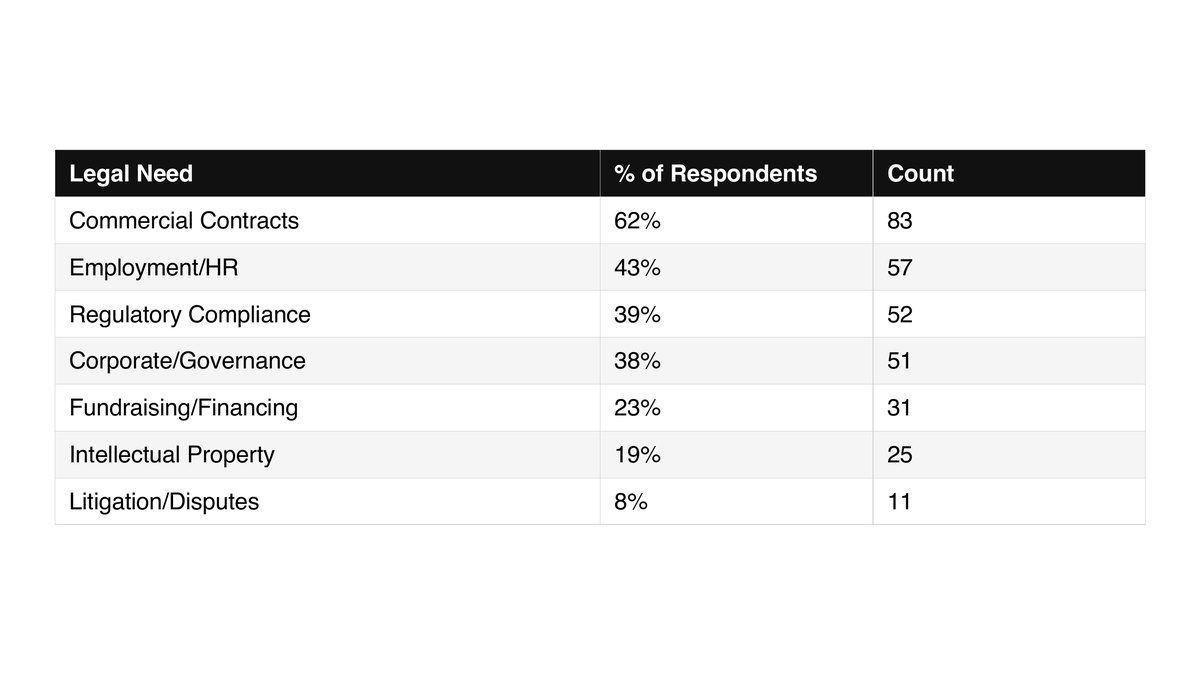
The top legal need by a wide margin is Commercial Contracts (62% of respondents), followed by Employment/HR (43%), Regulatory Compliance (39%), and Corporate/Governance (38%). Fundraising/Financing came in at 23%. Litigation and disputes registered at only 8%, suggesting that for most early-stage companies, legal is still a business enablement function rather than a defensive one.
Spend Outlook
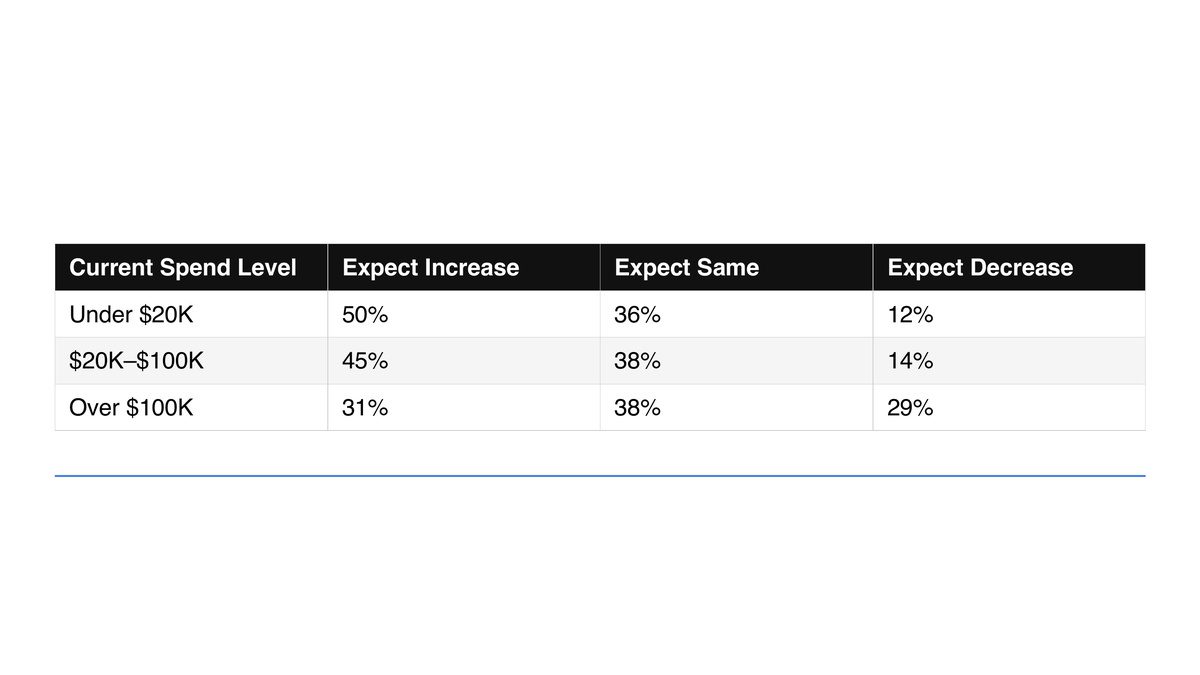
43% of respondents expect legal spending to increase in the next 12 months (14% significantly), while only 18% expect it to decrease. The outlook varies meaningfully by current spend level.
KEY FINDING
Half of the lowest spenders (under $20K) expect increases ahead. Meanwhile, 29% of the highest spenders expect decreases. Legal spend may be converging toward a middle band as early companies scale up and later-stage companies optimize.
External Counsel Still Dominates
46% of respondents exclusively use external firms, and another 16% primarily use external counsel with minimal in-house resources. Small law firms (2–24 attorneys) and large firms (100+) are used at nearly identical rates, 46% and 46% respectively. Solo practitioners are used by 28%, and mid-size firms by 25%. Legal tech platforms (18%) and online services like LegalZoom (16%) are gaining traction but remain supplementary.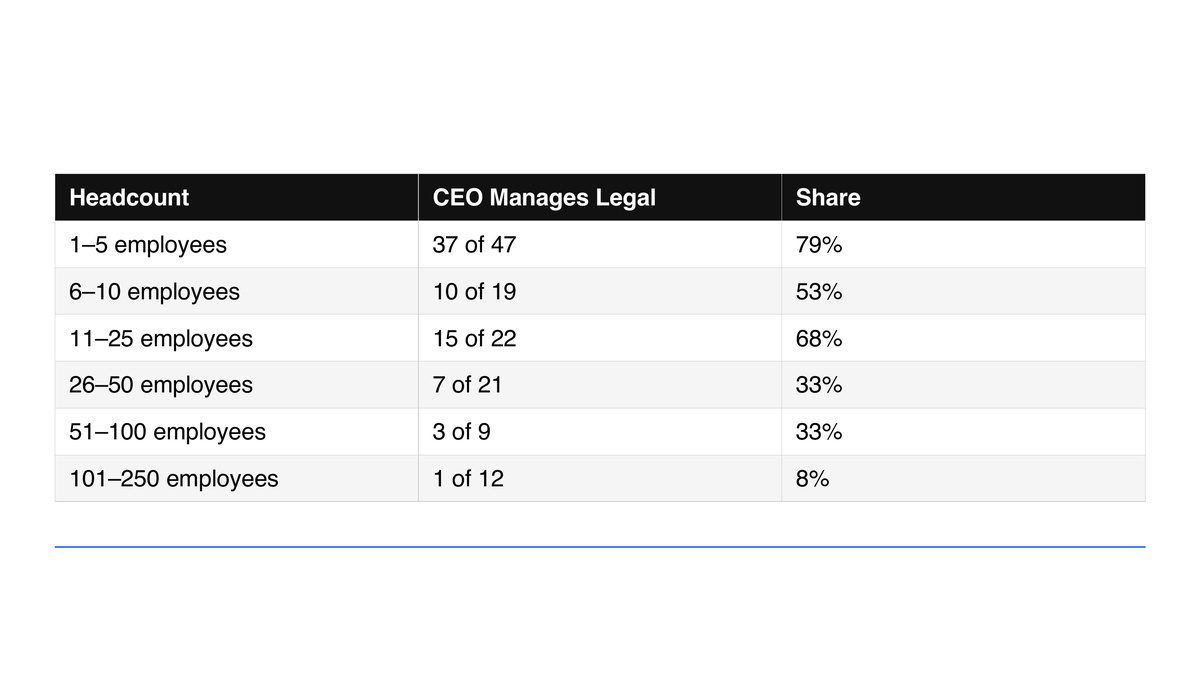
NPS by Legal Model
How a company structures its legal function has a measurable impact on satisfaction. Companies that exclusively use external law firms report the highest NPS at +21, with an average satisfaction score of 7.6. Every other approach scores lower.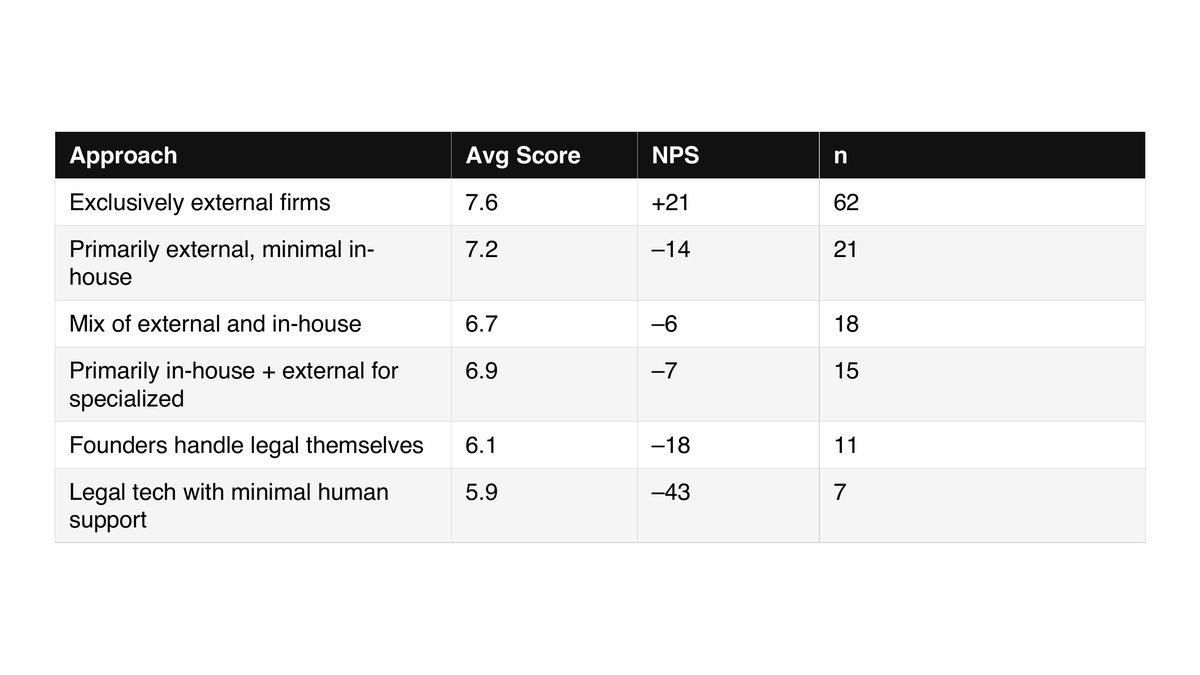
NPS by Provider Type
Not all providers are created equal in the eyes of their clients. Small law firms (+13 NPS) and large law firms (+11 NPS) generate the highest satisfaction, while online legal services like LegalZoom produce a sharply negative NPS of –32. Mid-size firms land at –3, suggesting they may occupy an uncomfortable middle ground: too expensive to feel like a value play, too small to bring the depth of a large firm.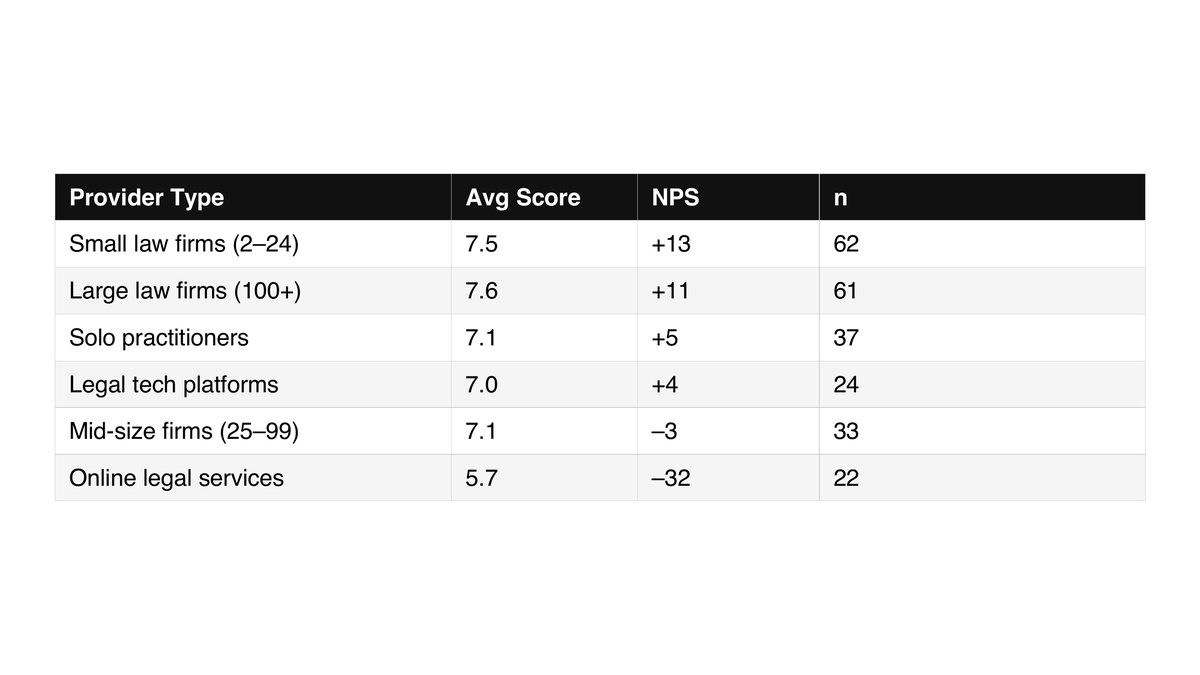
KEY FINDING
Online legal services (LegalZoom, Rocket Lawyer, etc.) have an NPS of –32, the worst of any provider type. Founders using these services are overwhelmingly dissatisfied. The “cheap and easy” value proposition does not appear to translate into perceived quality.
Section 4: AI Adoption in Legal
Overall AI Usage
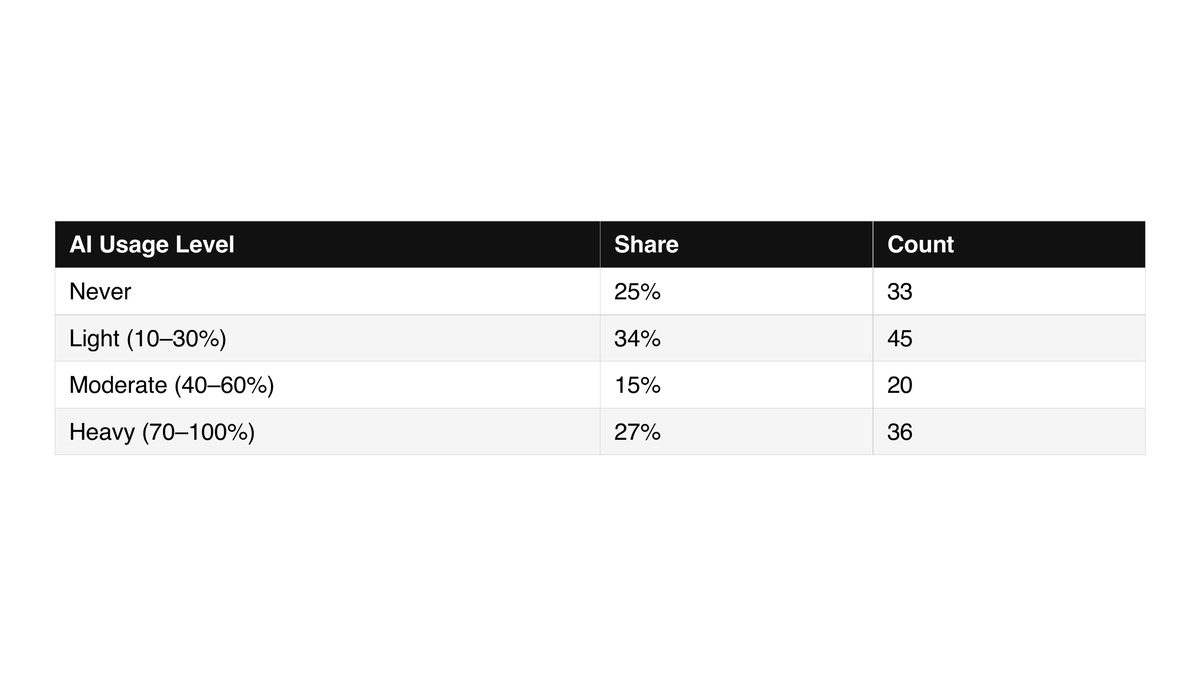
Three-quarters of respondents (75%) use AI tools to address legal questions at least some of the time before consulting a lawyer. A full 27% are heavy users (70–100% of the time). Only 25% report never using AI for legal questions.
AI Usage by Funding Stage
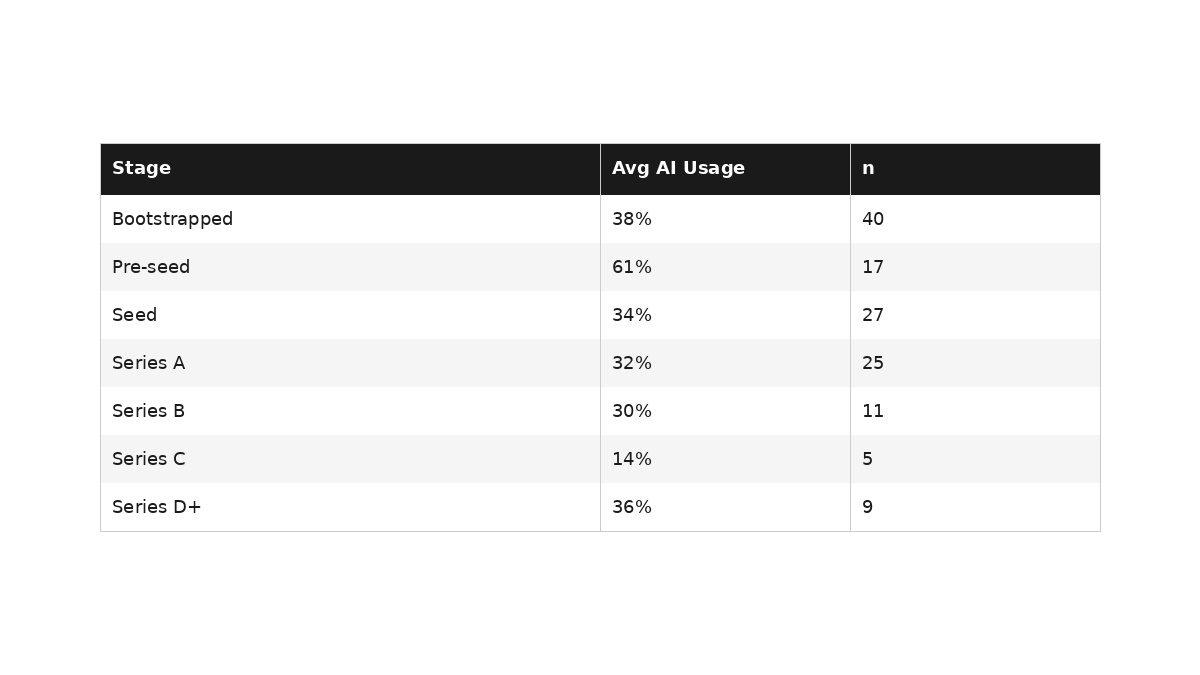
Pre-seed companies are the heaviest AI adopters, averaging 61% usage. This makes intuitive sense: the earliest-stage founders have the least budget and are most willing to experiment. Usage then settles into the 30–38% range for Seed through Series D+, with Series C as a notable dip at just 14%, likely reflecting the point where companies begin hiring dedicated legal teams and have less need to self-serve.
AI Usage by Industry
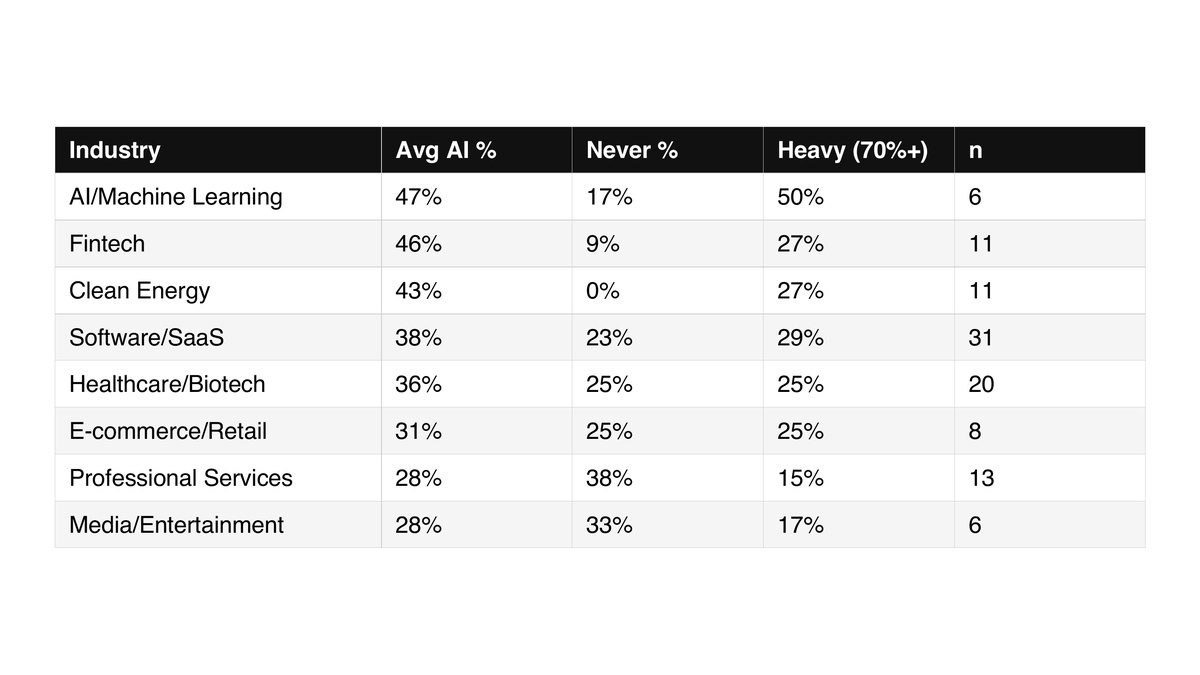
AI/ML companies are, unsurprisingly, the heaviest industry adopters: 50% are heavy users (70%+). More interesting is that Clean Energy has zero “never” users, with every single respondent using AI to some degree. Fintech is similar, with only 9% reporting “never.” Professional Services has the highest rate of non-adoption at 38%, which may reflect a more conservative or relationship-driven approach to legal matters.
AI Usage and Lawyer Satisfaction
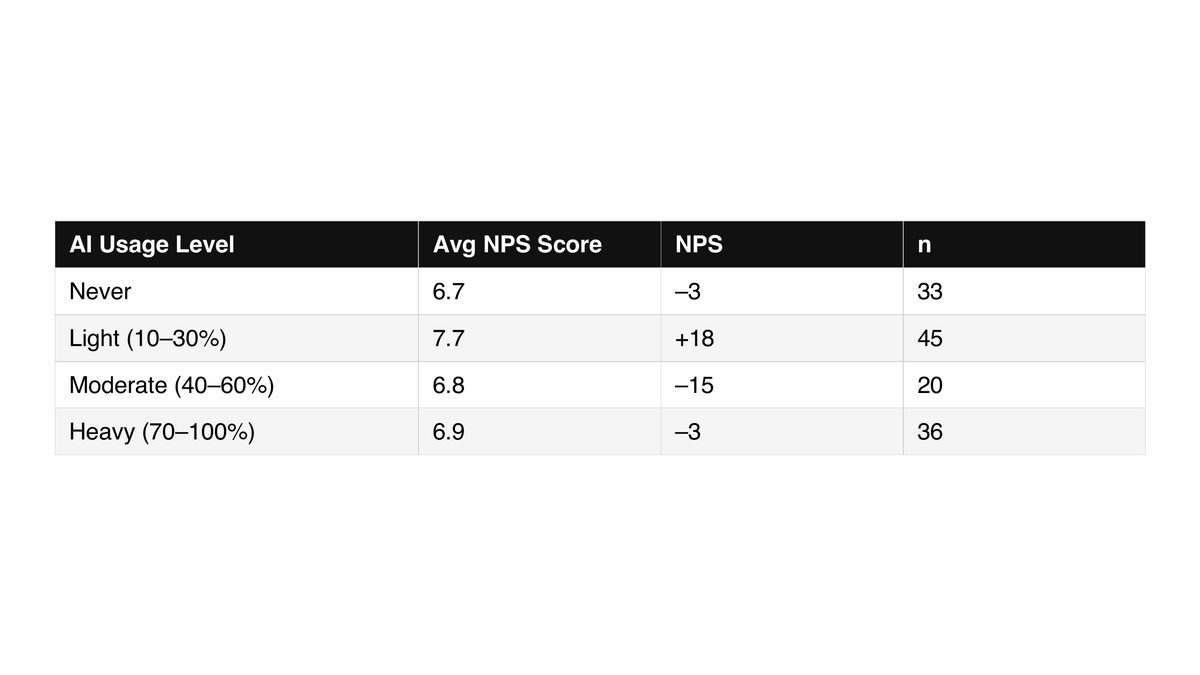
There is a surprising wrinkle in the data: light AI users (10–30%) report the highest lawyer satisfaction, with an NPS of +18 and an average score of 7.7. Heavy AI users (70–100%) and non-users both sit near zero. Moderate users (40–60%) are actually the least satisfied at –15 NPS.
KEY FINDING
The sweet spot appears to be using AI to prepare and triage (10–30% of the time), then engaging a lawyer for the real work. This group reports the highest satisfaction by a wide margin.
Why Does Heavier AI Usage Correlate with Lower Satisfaction?
The pattern is clear in the data, but the explanation is not. Correlation is not causation, and several competing theories could explain why moderate and heavy AI users report lower satisfaction with their attorneys. Each has different implications for how founders should think about integrating AI into their legal workflows.
The “Informed Consumer” Effect
Founders who use AI heavily develop a baseline understanding of legal concepts. When they then engage a lawyer, they can see more clearly what they’re paying for versus what they already knew. The perceived value-add of the attorney shrinks. A founder who has already read a solid AI-generated summary of 409A valuation rules may feel less impressed when their lawyer explains the same thing at $500/hour.
Selection Bias on Dissatisfaction
Maybe the causality runs the other way. Founders who had bad experiences with lawyers turned to AI as an alternative. They didn’t become dissatisfied because they use AI. They use AI because they were already dissatisfied. The moderate users (40–60%) might be the most telling group here: they’re in the messy middle of trying to reduce dependence on lawyers they don’t trust but haven’t fully committed to the DIY path.
Expectations Recalibration
AI tools are fast, available 24/7, and never send a bill. Once you get used to that experience, the traditional attorney engagement model (slow email responses, scheduling calls, waiting for drafts, getting invoiced weeks later) feels worse by comparison. It’s not that the lawyer got worse. It’s that the founder’s reference point for “good service” shifted.
The Dunning-Kruger Problem
Heavy AI users may overestimate their own legal sophistication. They push back more on attorney recommendations, second-guess advice, and create friction in the relationship. The attorney experience degrades from both sides: the founder thinks the lawyer isn’t adding value, and the lawyer feels micromanaged by someone who read a ChatGPT summary.
The “Uncanny Valley” of Partial Knowledge
Light users get just enough AI context to ask better questions and follow along more easily. They feel empowered in the relationship. Moderate and heavy users get enough knowledge to realize how much complexity exists but not enough to resolve it. They end up in a state of informed anxiety, where they know enough to worry but not enough to feel confident in their lawyer’s answers.
The most likely explanation is a blend of several of these factors. But for founders reading this report, the practical takeaway remains the same: use AI to prepare and triage, then stay open to your lawyer telling you something you didn’t expect. The founders who approach AI as a complement to counsel, rather than a replacement for it, report the best outcomes by a wide margin.
Section 5: The Geography Factor
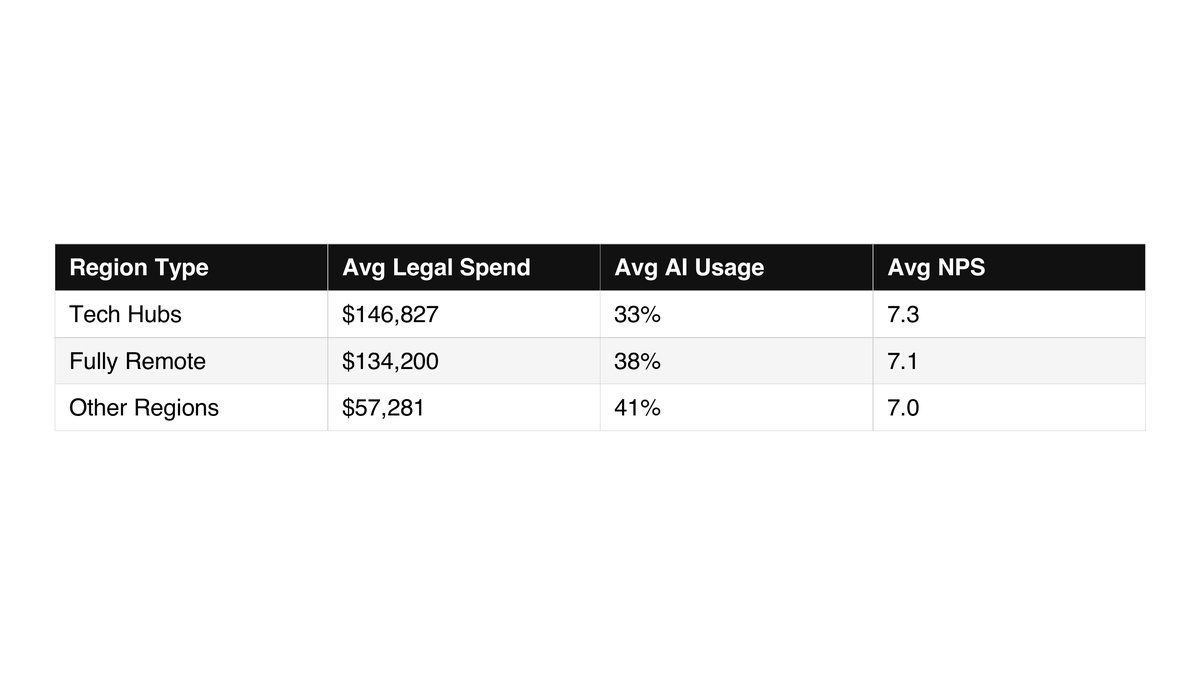
Geography shapes both spend and behavior in meaningful ways. Tech hub companies (SF, NYC, Boston, Seattle, LA) spend an average of $147K on legal, nearly 2.6x the $57K average outside those hubs. Fully remote companies fall in between at $134K.
AI adoption runs in the opposite direction: companies outside tech hubs use AI for legal questions 41% of the time, compared to 33% for hub-based companies. This makes sense. Founders with fewer local legal options turn to AI more aggressively to fill the gap. Despite spending less and using more AI, satisfaction scores are remarkably consistent across all three groups (7.0–7.3), suggesting that non-hub companies are finding workable solutions even without access to the deepest legal talent pools.
Section 6: Pain Points & Satisfaction
The Pain Point Hierarchy
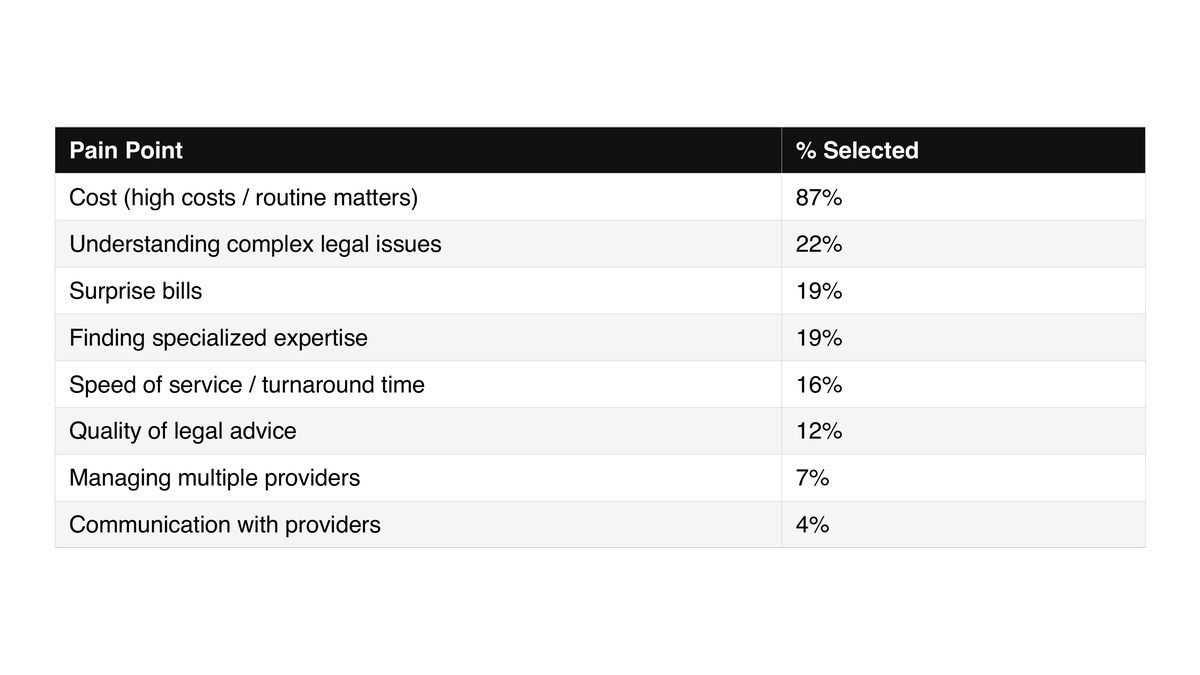
Cost is not just the top pain point. It is the defining theme of this survey. When we combine “high costs” and “finding cost-effective solutions for routine matters” into a single cost category (they are fundamentally two ways of expressing the same frustration), 87% of respondents flagged cost as a pain point. That is a near-universal complaint.
After understanding complex legal issues (22%) and finding specialized expertise (19%), surprise bills rank as the third most cited pain point at 19%, outranking both speed of service (16%) and quality of legal advice (12%). That ranking is worth pausing on.
Lawyer NPS: A Market in Neutral
The Net Promoter Score for startup lawyers is +2, barely in positive territory. The average recommendation score is 7.1 out of 10. One-third of respondents are promoters (9–10), another third are passives (7–8), and nearly a third are detractors (0–6). This is a market where founders tolerate their lawyers rather than champion them.
Detractor vs. Promoter Profile
Profiling detractors and promoters reveals meaningful differences. Detractors are more likely to have the CEO managing legal (68% vs. 57%), use AI more aggressively (45% avg vs. 37%), and flag communication and quality issues more often. They are disproportionately bootstrapped or seed-stage.
The communication gap is notable: 7% of detractors cite communication problems vs. 0% of promoters. No single promoter flagged communication as a pain point. This suggests that responsiveness and clarity may be the simplest lever for improving client satisfaction.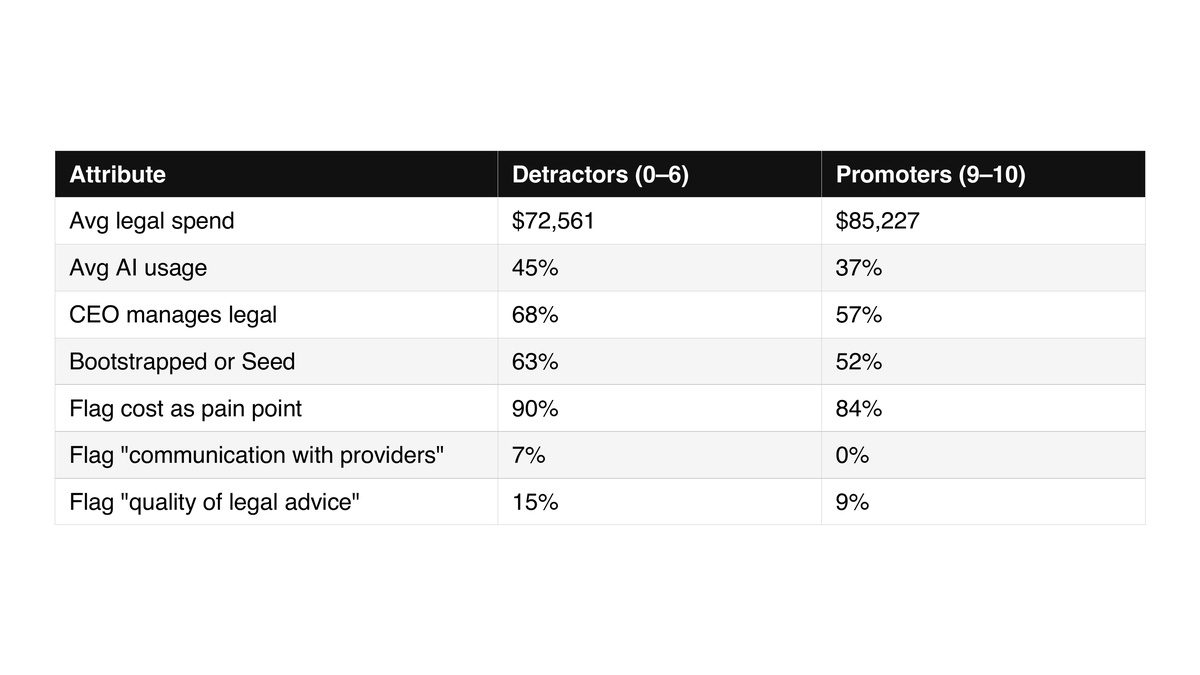
The Surprise Bill Effect
The cost conversation in startup legal tends to focus on rate and total spend. But surprise bills are a distinct and arguably more corrosive problem. When a founder receives an unexpected invoice, it does not just cost money. It breaks the implicit contract between client and attorney. The founder trusted the lawyer to scope the work, communicate costs, and deliver within expectations. A surprise bill signals that at least one of those things failed.
Interestingly, surprise bill reporters do not show meaningfully different NPS scores (7.2 vs. 7.1 overall). This may seem counterintuitive, but it actually reinforces the severity of the broader cost problem. They are one symptom of a pricing model that founders fundamentally distrust.
OPPORTUNITY
Surprise bills ranked higher than both speed of service and quality of legal advice. Founders care more about pricing predictability than turnaround time. For firms that want to stand out, eliminating surprise bills through flat-fee or capped-fee arrangements may be the single most tangible way to build trust with startup clients.
Section 7: Benchmarking Guide
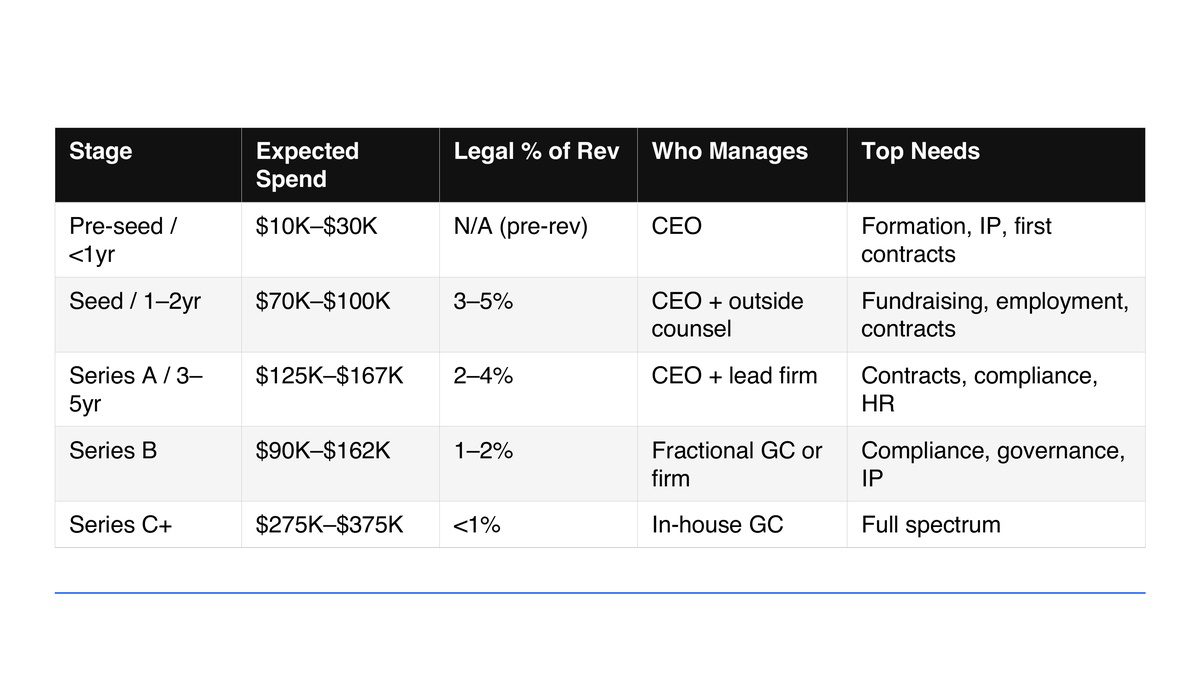
Based on the data, here is a practical benchmarking table for founders planning their legal budget. These figures represent survey averages and typical patterns, not prescriptive targets.
KEY FINDING
If you are a Seed-stage company spending less than $20K on legal, you are likely under-investing. If you are a Series B company with the CEO still managing legal, you may be leaving risk on the table.
Key Takeaways
Cost is the defining issue. When you combine “high costs” and “finding cost-effective solutions for routine matters” into a single category, 87% of respondents flagged cost as a pain point. For a market that is overwhelmingly early-stage and cash-constrained, traditional legal pricing is a structural mismatch.
Surprise bills are an underappreciated trust killer. 19% of founders ranked surprise bills as a top pain point, ahead of both speed of service (16%) and quality of advice (12%). The actual incidence is almost certainly higher. In a market already defined by cost anxiety, surprise bills erode the trust that makes an attorney-client relationship work. Firms that eliminate this risk through transparent pricing have a clear competitive advantage.
CEOs are doing too much legal work themselves. More than half of all respondents, and nearly 80% of the smallest companies, have their CEO managing legal. This persists well into the 11–25 employee range at 68%.
AI adoption is real but the sweet spot is “supplement, not replace.” 75% of founders use AI for legal questions, but light users (10–30%) report the highest satisfaction with their lawyers by a wide margin. Founders who use AI to prepare and triage, then engage counsel for the real work, get the best outcomes.
Satisfaction with lawyers is mediocre. An NPS of +2 signals a market where differentiation is achievable. Communication appears to be the simplest lever: zero promoters cited it as a pain point.
Regulated industries spend 2–3x more. Fintech and Blockchain/Crypto companies average $180K–$275K in legal spend, compared to $114K for SaaS. Industry context matters as much as stage when planning a legal budget.
Legal spend scales sharply with every dimension. The 6x jump from Bootstrapped to Seed, the 4x jump when crossing 6 employees, the inflection at $1M revenue. Founders who anticipate these thresholds will be better prepared.
Geography creates a two-track market. Tech hub companies spend 2.6x more than non-hub companies, but non-hub founders compensate with heavier AI usage and end up with comparable satisfaction scores.
Online legal services are not solving the problem. LegalZoom and similar platforms have an NPS of –32, the worst of any provider type. Small law firms (+13) and large firms (+11) generate far higher satisfaction.
The audience wants more. 87% want a benchmarked report. 40% volunteered for a follow-up interview. Founders are actively looking for better information and better options in legal services.
